 | Macro-Economic Case Study on Zambia
By Dr Eric Gondwe: Harvard University, Cambridge, MA, for International Economy & Business (Please credit all references when using this paper in your research, etc) INTRODUCTION This article is a case study on Zambia. The following outline of chapters shows the areas that the article has focused on. 1. Basic Facts on Zambia
2. Profile of the Economy
3. Developmental Challenges and Recommendations
4. Appendix 1: Map of Africa
5. Appendix 2: General Statistics on Zambia
6. Appendix 3: Economic Data of African Countries
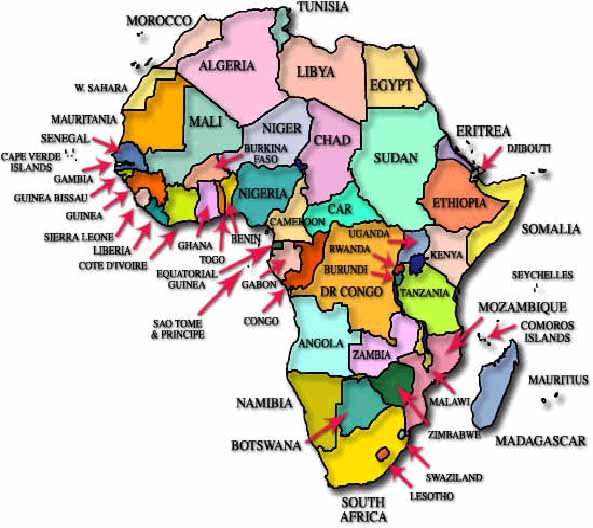
7. Appendix 4: Energy Consumption per Share of World Population 1. BASIC FACTS ON ZAMBIA The Republic of Zambia is a landlocked country in south central Africa, bordered by eight countries: Angola, Botswana, Democratic Republic of the Congo (DRC, formerly Zaire), Malawi, Mozambique, Namibia, Tanzania and Zimbabwe. See Appendix 1: Map of Africa. Its geographic area is 752,614 sq km (290,586 sq mi) slightly larger than the state of Texas (the second largest state of the Untied States of America, after Alaska) which has an area of 692,244 sq km (267,277 sq mi). Zambia’s capital and largest city is Lusaka. The population of Zambia at the time of the 1990 census was 7,818,447. A 2003 estimate was 10,307,333, giving the country an overall population density of 14 persons per sq km (35 per sq mi). Like many other African countries, ethnic diversity is a striking feature in Zambia. The relatively small population comprises of as many as 70 different languages. Almost all share the same historical origin of belonging to the Bantu-speaking group. This group has over 500 languages spoken in central, eastern, and southern Africa. Scholars estimate that the number of distinctive native languages spoken in Africa totals at least 2,000—more languages than are spoken on any other continent. Of these languages, about 50 have 500,000 or more speakers. In Zambia the major ones include Bemba, Nyanja, and Tonga. If there is any specific group that the Semitic religions (Christianity, Islam and Judaism) refer to as having been divided by God through language it’s probably those from Africa: “The Lord said, "If as one people speaking the same language they have begun to do this (building a large city and tower), then nothing they plan to do will be impossible for them. Come, let us go down and confuse their language so they will not understand each other,” Genesis 11:5-7. Colonialism though one of Africa’s biggest setbacks brought some unity among the people with the introduction of Christianity and European languages (mainly English and French). This brought a common identity. Needless to say that having the colonial governments as their common enemy also strengthened the unity. Former colonial countries are now facing a post-colonial version of colonialism known as neocolonialism. Although neocolonialism has no antagonistic remembrance to colonialism its economic effects are overwhelming. Zambia is a British former colony and has adopted English as its national language. 2. PROFILE OF THE ZAMBIAN ECONOMY Zambia has historically had a copper mining driven economy. In 1969 it was the largest copper producer in the developing world and the world’s third largest producer of copper, producing 12.2 percent of world copper output (Bostock and Harvey, 1972). First was the United States and second was the former USSR. Since its independence in 1964 up to 1980 Zambia had trade surpluses year after year. It had a positive Balance of Payments (BOP). The total value of its exports was more than the total value of its imports (See Table 1. Foreign Trade Historical Summary below). The main export was copper accounting for over 90 percent of total export earnings. Main imports included machinery, manufactured goods, oil, food, chemicals. Zambia’s per capita Gross National Product (GNP) was one of the highest in Africa. Table 1. Foreign Trade Historical Summary (1966): Exports, £246.7 million; imports, £123 million. (1967): Exports, k468 million; imports, k306 million. (1968): Exports, k541 million; imports, k327 million. (1969): Exports, K766.5 million; imports, K311.8 million. (1972): Exports, US$758 million; imports, US$565 million. (1973): Exports, US$1.14 billion; imports, US$532 million. (1974): Exports, $1,407 million; imports, $910 million. (1975): Exports, $810 million; imports, $1,138 million. (1977): Exports, $920.4 million; imports, $731.5 million. (1978): Exports, $828 million; imports, $621 million. (1979 est.): Exports, K1,080 million; imports, K625 million. (1980 est.): Exports, $1,013.2 million; imports, $612.5 million. (1981): Exports, $1.05 billion; imports, $1.26 billion. £=Pound Sterling, $=U.S. dollars, K=Zambian Kwacha | Source: Microsoft® Encarta® Reference Library 2003 |
However, the oil crisis of the early 1970’s caused world commodity prices to collapse, as global demand dropped. Since 1974 there has been a sharp and prolonged fall in the world prices of copper. The oil crisis had oil prices rising while commodity prices falling. The increase in oil prices and other affected commodities combined with the plunging copper prices caused major problems for Zambia’s oil imports and export earnings from copper. This drastically affected its BOP and ultimately its economy. The problem continued getting worse as world copper prices continued to decline. This has been the biggest cause of the deep and prolonged recession in the Zambian economy. Today, the country ranks as one of the poorest countries in the world with a Gross Domestic Product (GDP) per capita of $290 ((U.S. dollars) World Bank, 2000). See Appendix 3: Economic Data of African Countries. Below is an account of Zambia’s current economic status by sector of the economy. A. Labor In 2001 some 4.4 million Zambians participated in the labor force. The principal labor organization is the Zambia Congress of Trade Union (ZCTU)s, which has about 400,000 members. Civil servants and miners also have unions. B. Agriculture Some 75 percent of Zambia’s working population is engaged in agriculture, largely subsistence farming. Principal crops and the amount produced in metric tons in 2002 were corn, the staple grain (900,000); sugarcane (1.8 million); and cassava (1 million). Sunflower seeds, peanuts, sweet potatoes, and tobacco are also grown. Beef and dairy cattle are raised for domestic use. The agricultural sector remains underdeveloped and has recently been more vulnerable to weather fluctuations. Food shortages have occurred although Zambia has been said to be capable of feeding the whole Southern Africa with its many agricultural natural resources. C. Mining The copper mines of Zambia are among the richest in the world. Although world copper prices collapsed in 1975, damaging the Zambian economy, in the early 1990s the country still received about half of its export earnings from copper. Output in 2001 was 299,300 metric tons. Zambia is also among the world’s largest producers of cobalt. Other minerals extracted were gold (130 kg/287 lb), silver (5 metric tons), and gem-quality emeralds. A diamond field was discovered in 1992. D. Manufacturing Manufacturing, mining, and construction employ only 8 percent of the labor force but account for 26 percent of the gross domestic product (GDP). Principal activities were the smelting and refining of copper and other metals, vehicle assembly, petroleum refining, food processing, and the production of fertilizers, explosives, and textiles. E. Currency and Banking The decimal system of currency, issued in 1968, is based on the kwacha, consisting of 100 ngwee (3,611 kwachas equal U.S.$1; 2001 average). The country’s central bank is the Bank of Zambia (1964). Commercial, development, and foreign banks are widely represented. F. Foreign Trade Imports such as machinery and transport equipment, mineral fuels and lubricants, chemicals, food, and basic manufactured goods totaled $932 million in 2000. Exports chiefly copper and cobalt—totaled $800 million. The main partners for exports are Japan, Saudi Arabia, Thailand, Taiwan, India, Belgium and Luxembourg (which constitute a single trading entity), France, and Malaysia. The main partners for imports are South Africa, the United Kingdom, Zimbabwe, Japan, Saudi Arabia, and the United States. G. Transportation and Communications Zambia has 1,273 km (791 mi) of railroads. A railroad from Zimbabwe runs to Livingstone, Lusaka, and Ndola, connecting with the Democratic Republic of Congo (DRC) rail system, and then to Benguela on the Atlantic coast of Angola. The Tanzania-Zambia Railroad (Tazara) connects Lusaka with the port of Dar es Salaam in Tanzania. Some 66,781 km (41,496 mi) of roads connect the towns of Zambia. Lusaka is served by an international airport. The government operates radio and television stations in Lusaka and Kitwe. In 1999 there were 149 radio receivers and 142 television sets in use for every 1,000 inhabitants.
3. DEVELOPMENTAL CHALLENGES AND RECOMMENDATIONS TWO OIL CRISES END ZAMBIA’S ECONOMIC PROSPERITY The oil crisis of the early 1970’s marked the end of Zambia’s short-lived economic prosperity by 1980. A discussion of the oil crisis is important to understand its impact on the country’s economy. In the early years of last century petroleum (also known as crude oil) replaced coal as the major source of energy. The increased advancements and use of the internal-combustion engine and the automobile industry intensified the importance of oil. As a result, oil companies from industrialized countries that had little or no sources of their own especially Britain, the Netherlands, and France began to search for oil in many parts of the world, particularly in the Middle East. The US had it’s own sources and imported some from Mexico. In the second half of last century, after World War II, US oil companies, with occasional federal support, began to search for more oil sources as the petroleum business became more profitable. The US was still largely self-sufficient with its oil imports limited by a quota. By 1955 five major U.S. oil companies produced two-thirds of the oil for the world oil market (not including North America and the Soviet bloc). Two British-based companies produced almost one-third of the world’s oil supply, and the French produced a mere one-fiftieth. The seven major U.S. and British oil companies therefore controlled the price and quantity of oil. They were able to provide the world with increasing quantities of cheap oil. The world price was about a dollar a barrel. As cheap oil benefited much of the world economies the governments of the major oil-exporting countries were not pleased with this development. This was because lower prices reduced their income from the oil companies. In 1960, enraged by unilateral cuts in oil prices by the seven major U.S. and British oil companies, the governments of the major oil-exporting countries formed the Organization of Petroleum Exporting Countries (OPEC). OPEC’s goal was to try to prevent further cuts in the price that the member countries—Venezuela and four countries around the Persian Gulf—received for oil. They succeeded, but for a decade they were unable to raise prices. In the meantime, increasing oil consumption throughout the world, especially among Western nations and Japan, caused an enormous expansion in the demand for oil products. Please see Appendix 4: Energy Consumption per Share of World Population. However, OPEC began to use the supply of oil as a political tactic in the 1970’s. The Arab-Israeli War of 1973 over the land of historic Palestine prompted the Middle East nations to stop delivery of oil to nations supporting Israel in the Arab-Israeli conflict. From October 1973 to November 1974, the oil-producing Arab countries maintained an embargo on oil exports to Western nations friendly to Israel, causing gasoline shortages and inflated oil prices. October 1973 marked the end of the era of secure, cheap oil and ushered in an insecure industry. Although the Arab cutbacks represented a loss of less than 7 percent in world supply, they created panic on the part of oil companies, consumers, oil traders, and some governments. Wild bidding for crude oil ensued when a few producing nations began to auction off some of their oil. This bidding encouraged the OPEC nations, which now numbered 13, to raise the price of all their crude oil to a level as high as eight times that of a few years earlier. The world oil scene gradually calmed, as a worldwide recession brought on in part by the higher oil prices trimmed the demand for oil. In the meantime, most OPEC governments took over ownership of the oil fields in their countries. In 1978 a second oil crisis began when, as a result of the revolution that eventually drove the Shah of Iran from his throne, Iranian oil production and exports dropped untimely. Because Iran was a major exporter, consumers again panicked. A repetition of 1973 events, complete with wild bidding, again forced up oil prices during 1979. The outbreak of war between Iran and Iraq in 1980 gave a further boost to oil prices. By the end of 1980 the price of crude oil stood at 19 times what it had been just ten years earlier. These oil crises caused world commodity prices to collapse, as global demand dropped leading to a worldwide recession. Since 1974 there has been a sharp and prolonged fall in the world prices of copper. The oil crisis had oil prices rising while commodity prices falling. The increase in oil prices and other affected commodities combined with the plunging copper prices caused major problems for Zambia’s oil imports and export earnings from copper. This drastically affected its BOP and ultimately its economy. The problem continued getting worse as world copper prices continued to decline. This has been the biggest cause of the deep and prolonged recession in the Zambian economy. Thus despite the low world oil prices that have prevailed since 1986 the value of copper, Zambia’s economic backbone has continued at a low price. The country continues to suffer with an economy that is still largely determined by copper. By 1977 the government had completely exhausted its foreign reserves (Hawkins 1991: 844). From the 1980’s onwards its BOP has been in the negative. It found itself in a situation where the money it received (in export earnings and aid funding) failed to cover the cost of oil imports. This brought foreign exchange shortage since its exports could not bring in the needed revenue to buy imports. The country ended up meeting its increased need for foreign exchange by borrowing funds, rather than by curtailing other imports or increasing exports. Its national budget continued to grow in spite of the decline in revenues (See Table 2. Annual National Budget Historical Summary, below). Thus, it failed to adjust to the new scarcity of foreign exchange. Borrowing increased foreign debts and only worsened its long-term balance of payments problems, since in the future it would have to pay not only for imports, but also for debt service. (1965-1966): revenue, £ 84,422,000; expenditure, £ 62,449,770. (1966-1967): revenue, £122.97 million (plus £11.98 million capital fund); expenditure, £82.24 million (plus £68.27 million capital fund); (1968): revenue, k250,124,000; expenditure, k195,790,693. (1969): revenue, k296,909,000; expenditure, k279,554,000. (1970): revenue, K334.1 million; expenditure, K244.3 million. (1974 est.): balanced at K435.97 million. (1975): expenditures, K755.5 million; revenue, K644.1 million (1978): expenditure K792.8 million; revenue, K702.8 million. (1979): expenditure, K849.4 million; revenues, K583.9 million. (1980): expenditures K1,029.6 million; revenues, K758 million. (1981): expenditure, ZK1,187 million; revenues, ZK887 million. (1982): expenditure, ZK1,501 million; revenues, ZK1,038 million. (1996): expenditure $705 million; revenue $613 million | £=Pound Sterling, $=U.S. dollars, K=Zambian Kwacha Source: Microsoft® Encarta® Reference Library 2003 |
Zambia is now one of the countries in the world with very high external debt. In 1970, for instance, Zambia’s total external debt was only US$654 million. By 1991, the external debt had risen 11 times as much, to US$ 7.19 billion (World Bank, 1993: 68). Much of this debt has been incurred to try and offset the reduction in copper export earnings. Acceleration in debt accumulation occurred most rapidly between 1978 - 1987 when there was a sharp decline in copper revenue. During 1978 - 1982, copper revenue was US$1,091 million; but by 1983 - 1987, the revenue fell drastically to US$649 million. To offset this fall, the Government increased the rate of external borrowing. As a result, external borrowing rose from US$191 million during 1979 - 1982 to US$ 516 in 1983 - 1987. The country now spends over 40 percent of its export earnings to service the external debt. Other problems of servicing the external debt are that: i) Zambia’s debt burden may continue to worsen as “catching” up with its payments continues to worsen as the economy is unable to sustain. ii) there has been a decline in Zambia’s credit worthiness in commercial bank circles because of the build-up of debt repayment arrears; and iii) there is need to solve the problems of the external debt before Zambia can achieve sustainable development. The overall economic effects of the endless recession since the mid 1970’s have included the following: i) there is a decline in other sectors of the Zambian economy; ii) there is a decline in the living standards of most Zambians; iii) there are persistent balance of payments problems in Zambia; iv) Debt servicing has become a heavy economic burden taking up over 40 percent of its export earnings The living standards for the average Zambian are now at their lowest in its national history. By 1991, 67 percent of Zambians lived below the poverty line. (World Bank, 1993: 14). Hunger and starvation, experiences never heard of before began to be a common feature since the 1990 when the economy drastically changed from the command to free market system. Combined with the AIDS crisis, one of the highest in the world, life expectancy has dropped to 35 years. In turn, the increase in poverty has led to an increase in socio-economic problems, such as, rise in crime, rise in infant mortality rate and decrease in school enrollment. Please see Appendix 2: General Statistics on Zambia. RECOMMENDATIONS The Zambian economy is still highly foreign trade dependent. It is therefore vulnerable to global changes that affect its export earnings. Success in meeting sustained annual economic growth depends largely on 1) world prices for copper, 2) continued foreign investor confidence, and 3) the government’s ability to maintain a conservative fiscal measures and adequate economic policies. Among these three variables the government needs to continue effectively working on 2 and 3. The most important requirement is the need for diversification. Copper has proved to be a non-performer for its economy since the Oil Crisis in the 1970s. It has almost no voice to influence world copper prices which are largely determined by the London Metal Exchange (LME). Most of the world’s copper is traded on the (LME), with the Commodity Exchange of New York (COMEX) playing the second most important role. In addition, copper has become an increasing burden to its economy in terms of resource use and allocation. Zambia’s mining company, Zambia Consolidated Copper Mines Limited (ZCCM) uses 60 percent of all commercial energy (electricity, petroleum products, coal and coke) consumed in the country (Republic of Zambia, 1985, p. 52). The areas the country needs to diversify in include agriculture, other non-copper mining, manufacturing and tourism. However, economic progress is not possible with domestic investment alone. It needs foreign direct investment (FDI) through multinational corporations (MNCs) and other foreign companies which bring with them not only capital but also new technology, new markets, new skills and new mindsets. It has enough cheap labor, a conducive democratic political environment and strict monetary and fiscal measures that have been pursued since the early 1990s to attract the needed FDI. The only major problem is how willing foreign companies are willing to invest. So far the biggest willingness has come from South African corporations. Zimbabwe’s white farmers fleeing government persecution have also been settling in Zambia. It is hoped that foreign industrialized countries, in particular, their governments will endeavor to pursue a friendlier stance towards poor nations such as Zambia and influence their companies to invest in these countries. Investment will not only benefit their companies it’ll also enable the host countries to service their debts effectively. In addition, it’s important that a win-win trade approach is pursued that enables citizens of these economies to benefit from trade rather than being exploited by it. 4. APPENDIX 1: POLITICAL MAP OF AFRICA
5. APPENDIX 2: GENERAL STATISTICS ON ZAMBIA The People of Zambia (Demographics)
Population 10,307,333 (2003 estimate)
Population growth
Population growth rate 1.52 percent (2003 estimate)
Projected population in 2025 12,840,186 (2025 estimate)
Projected population in 2050 16,525,803 (2050 estimate)
Population density 14 persons per sq km (2003 estimate) 35 persons per sq mi (2003 estimate)
Urban/rural distribution
Share urban 40 percent (2001 estimate)
Share rural 60 percent (2001 estimate)
Largest cities, with population
Lusaka 1,640,000 (2000 estimate)
Ndola 441,624 (1999 estimate)
Kitwe 467,084 (1999 estimate)
Kabwe 233,197 (1999 estimate)
Chingola 211,755 (1999 estimate)
Main Ethnic groups and Languages (from more than 70 indigenous languages)
Bemba, Nyanja, Tonga, Lozi, Kaonde, Lunda, Luvale, etc
English, from its British colony is the country’s national language
Religious affiliations
Roman Catholic 33 percent
Protestant 30 percent
Independent Christian 17 percent
Ethnoreligionist or indigenous beliefs 14 percent
Baha'i 2 percent
Other 4 percent
Health and Education
Life expectancy
Total 35.3 years (2003 estimate)
Female 35.3 years (2003 estimate)
Male 35.3 years (2003 estimate)
Infant mortality rate 99 deaths per 1,000 live births (2003 estimate)
Population per physician 13,859 people (1999)
Population per hospital bed Not available
Literacy rate
Total 80.6 percent (2003 estimate)
Female 74.8 percent (2003 estimate)
Male 86.8 percent (2003 estimate)
Education expenditure as a share of gross national product (GNP) 2.5 percent (1998-1999)
Number of years of compulsory schooling 7 years (2000)
Number of students per teacher, primary school 47 students per teacher (1999-2000)
Government
Form of government: Republic
Head of state: President
Head of government: President
Legislature: Unicameral legislature
National Assembly: 158 members
Voting qualifications Universal at age 18
Constitution: 28 May 1996
Highest court: Supreme Court
Armed forces
Total number of military personnel: 21,600 (2001)
Military expenditures as a share of gross domestic product (GDP) 0.8 percent (2001)
First-level political divisions 9 provinces
Economy
Gross domestic product (GDP, in U.S.$) $3.6 billion (2001)
GDP per capita (U.S.$) $350 (2001)
GDP by economic sector
Agriculture, forestry, fishing 22.1 percent (2001)
Industry 25.6 percent (2001)
Services 52.3 percent (2001)
Employment
Number of workers 4,390,628 (2001)
Workforce share of economic sector
Agriculture, forestry, fishing 75 percent (1990)
Industry 8 percent (1990)
Services 17 percent (1990)
Unemployment rate 15 percent (1996)
National budget (U.S.$)
Total revenue $613 million (1996)
Total expenditure $705 million (1996)
Monetary unit
1 Zambian kwacha (K), consisting of 100 ngwee
Major trade partners for exports
United Kingdom, South Africa, Switzerland, Malawi, and Saint Pierre and Miquelon
Major trade partners for imports
South Africa, United Kingdom, Zimbabwe, United States, and Japan
Energy, Communications, and Transportation
Electricity production
Electricity from thermal sources 0.53 percent (2001 estimate)
Electricity from hydroelectric sources 99.47 percent (2001 estimate)
Electricity from nuclear sources 0 percent (2001 estimate)
Electricity from geothermal, solar, and wind sources 0 percent (2001 estimate)
Number of radios per 1,000 people 149 (1999 estimate)
Number of telephones per 1,000 people 8 (2001)
Number of televisions per 1,000 people 142 (2000 estimate)
Number of Internet hosts per 10,000 people 1 (2001)
Daily newspaper circulation per 1,000 people 14 (1996)
Number of motor vehicles per 1,000 people 26 (1997)
Paved road as a share of total roads 18 percent (1998)
Source: Microsoft ® Encarta ® Reference Library 2003. © 1993-2002 Microsoft Corporation
6. APPENDIX 3: ECONOMIC DATA OF AFRICAN COUNTRIES | Gross Domestic Product (GDP) | Share of GDP (%) | Country | GDP (U.S. dollars) | Annual GDP Growth Rate (%,1990-2000) | GDP Per Capita (U.S. dollars) | Agriculture | Industry | Service | Algeria | 53 billion (2000) | 1.87 | 1,750 (2000) | 8.6 (2000) | 60.3 (2000) | 31.2 (2000) | Angola | 8.8 billion (2000) | 1.33 | 670 (2000) | 5.7 (2000) | 76.1 (2000) | 18.2 (2000) | Benin | 2.17 billion (2000) | 4.74 | 350 (2000) | 38.0 (2000) | 14.4 (2000) | 47.6 (2000) | Botswana | 5.3 billion (2000) | 4.69 | 3,300 (2000) | 3.6 (2000) | 44.4 (2000) | 52.0 (2000) | Burkina Faso | 2.19 billion (2000) | 4.90 | 190 (2000) | 34.5 (2000) | 17.2 (2000) | 48.3 (2000) | Burundi | 689 million (2000) | -2.56 | 100 (2000) | 50.7 (2000) | 18.5 (2000) | 30.8 (2000) | Cameroon | 8.9 billion (2000) | 1.72 | 600 (2000) | 43.8 (2000) | 20.2 (2000) | 35.9 (2000) | Cape Verde | 558 million (2000) | 6.04 | 1,270 (2000) | 11.8 (2000) | 17.6 (2000) | 70.6 (2000) | Central African Republic | 967 million (2001) | 2.03 | 260 (2000) | 54.6 (2000) | 19.8 (2000) | 25.6 (2000) | Chad | 1.41 billion (2000) | 2.24 | 180 (2000) | 39.2 (2000) | 13.8 (2000) | 47.0 (2000) | Comoros | 202 million (2000) | 0.09 | 360 (2000) | 40.9 (2000) | 11.9 (2000) | 47.2 (2000) | Côte d'Ivoire | 9.4 billion (2000) | 3.48 | 590 (2000) | 29.2 (2000) | 22.4 (2000) | 48.4 (2000) | Democratic Republic of the Congo | 5.6 billion (1998) | -5.09 | 120 (1998) | 57.9 (1998) | 16.9 (1998) | 25.2 (1998) | Djibouti | 553 million (2000) | -1.37 | 870 (2000) | 3.7 (2000) | 14.2 (2000) | 82.1 (2000) | Egypt | 99 billion (2000) | 4.57 | 1,540 (2000) | 16.6 (2000) | 34.0 (2000) | 49.4 (2000) | Equatorial Guinea | 1.34 billion (2000) | 22.06 | 2,930 (2000) | 7.0 (2000) | 88.0 (2000) | 4.9 (2000) | Eritrea | 608 million (2000) | 3.87 | 150 (2000) | 17.1 (1999) | 29.2 (1999) | 53.7 (1999) | Ethiopia | 6.4 billion (2000) | 4.71 | 100 (2000) | 52.3 (2000) | 11.1 (2000) | 36.5 (2000) | Gabon | 4.93 billion (2000) | 2.83 | 4,010 (2000) | 6.4 (2000) | 53.2 (2000) | 40.4 (2000) | Ghana | 5.2 billion (2000) | 4.27 | 270 (2000) | 35.3 (2000) | 25.4 (2000) | 39.3 (2000) | Guinea | 3.01 billion (2000) | 4.26 | 410 (2000) | 24.0 (2000) | 37.1 (2000) | 38.9 (2000) | Guinea-Bissau | 215 million (2000) | 1.18 | 180 (2000) | 58.8 (2000) | 12.3 (2000) | 28.9 (2000) | Kenya | 10 billion (2000) | 2.06 | 340 (2000) | 19.9 (2000) | 18.7 (2000) | 61.3 (2000) | Lesotho | 899 million (2000) | 4.13 | 440 (2000) | 16.9 (2000) | 43.8 (2000) | 39.3 (2000) | Liberia | Not available | Not avail. | Not available | Not available | Not available | Not available | Libya | Not available | Not avail. | Not available | Not available | Not available | Not available | Madagascar | 3.88 billion (2000) | 2.03 | 250 (2000) | 34.9 (2000) | 13.1 (2000) | 52.0 (2000) | Malawi | 1.70 billion (2000) | 3.76 | 160 (2000) | 41.6 (2000) | 19.1 (2000) | 39.4 (2000) | Mali | 2.30 billion (2000) | 3.82 | 210 (2000) | 45.8 (2000) | 17.1 (2000) | 37.1 (2000) | Mauritania | 935 million (2000) | 4.20 | 350 (2000) | 22.4 (2000) | 30.6 (2000) | 47.0 (2000) | Mauritius | 4.38 billion (2000) | 5.25 | 3,690 (2000) | 6.0 (2000) | 32.1 (2000) | 61.9 (2000) | Morocco | 33 billion (2000) | 2.34 | 1,160 (2000) | 13.5 (2000) | 32.2 (2000) | 54.3 (2000) | Mozambique | 3.75 billion (2000) | 6.35 | 210 (2000) | 24.4 (2000) | 25.1 (2000) | 50.5 (2000) | Namibia | 3.48 billion (2000) | 4.14 | 1,980 (2000) | 10.7 (1999) | 28.3 (1999) | 60.9 (1999) | Niger | 1.83 billion (2000) | 2.44 | 170 (2000) | 38.8 (2000) | 17.6 (2000) | 43.6 (2000) | Nigeria | 41 billion (2000) | 2.44 | 320 (2000) | 29.5 (2000) | 46.0 (2000) | 24.5 (2000) | Republic of the Congo | 3.21 billion (2000) | -0.41 | 1,070 (2000) | 5.3 (2000) | 70.9 (2000) | 23.8 (2000) | Rwanda | 1.79 billion (2000) | -0.19 | 210 (2000) | 43.7 (2000) | 21.2 (2000) | 35.1 (2000) | São Tomé and Príncipe | 46 million (2000) | 1.77 | 310 (2000) | 20.5 (2000) | 17.0 (2000) | 62.5 (2000) | Senegal | 4.37 billion (2000) | 3.63 | 460 (2000) | 18.2 (2000) | 26.9 (2000) | 55.0 (2000) | Seychelles | 614 million (2000) | 2.65 | 7,550 (2000) | 3.0 (2000) | 21.6 (2000) | 75.4 (2000) | Sierra Leone | 636 million (2000) | -4.32 | 130 (2000) | 47.3 (2000) | 29.7 (2000) | 23.0 (2000) | Somalia | Not available | Not available | Not available | Not available | Not available | Not available | South Africa | 126 billion (2000) | 1.99 | 2,940 (2000) | 3.2 (2000) | 30.9 (2000) | 65.9 (2000) | Sudan | 12 billion (2000) | 8.13 | 370 (2000) | 37.2 (2000) | 18.1 (2000) | 44.7 (2000) | Swaziland | 1.48 billion (2000) | 3.33 | 1,410 (2000) | 16.8 (2000) | 44.3 (2000) | 38.9 (2000) | Tanzania | 9 billion (2000) | 2.95 | 270 (2000) | 45.1 (2000) | 15.8 (2000) | 39.1 (2000) | The Gambia | 422 million (2000) | 3.11 | 320 (2000) | 37.9 (2000) | 12.7 (2000) | 49.3 (2000) | Togo | 1.22 billion (2000) | 2.30 | 270 (2000) | 37.7 (2000) | 22.2 (2000) | 40.2 (2000) | Tunisia | 19 billion (2000) | 4.66 | 2,040 (2000) | 12.3 (2000) | 28.8 (2000) | 58.9 (2000) | Uganda | 6.2 billion (2000) | 7.02 | 280 (2000) | 42.5 (2000) | 19.1 (2000) | 38.4 (2000) | Zambia | 2.91 billion (2000) | 0.47 | 290 (2000) | 27.3 (2000) | 24.1 (2000) | 48.6 (2000) | Zimbabwe | 7.4 billion (2000) | 2.47 | 590 (2000) | 18.5 (2000) | 25.0 (2000) | 56.5 (2000) | Source: World Bank, Organization for Economic Cooperation and Development. (Document found in Microsoft ® Encarta ® Reference Library 2003. © 1993-2002 Microsoft Corporation |
7. APPENDIX 4: ENERGY CONSUMPTION PER SHARE OF WORLD POPULATION, 1999 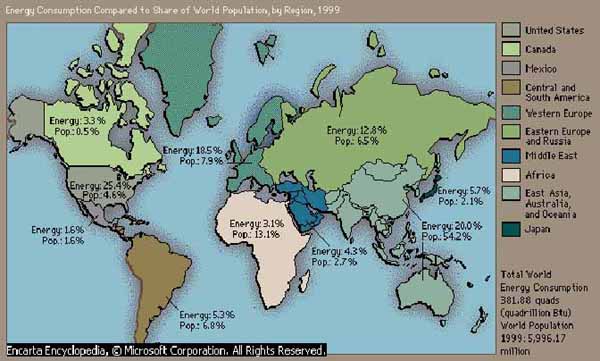
World Energy Consumption by Region
Much of the world’s energy comes from nonrenewable resources, such as oil, coal, and natural gas. Although these resources are distributed over a large geographical region, consumption of energy centers in industrialized nations. This table shows the percent of the world’s total energy supply used by each region. Oil is not the only resource involved in the comparison; oil equivalents are provided to give perspective to the percentages.
Microsoft ® Encarta ® Reference Library 2003. © 1993-2002 Microsoft Corporation.
REFERENCES The Economist. July 1, 2002 Microsoft® Encarta® Reference Library 2003. © 1993-2002 Microsoft Corporation. Bostock, Mark and Charles Harvey, 1972. Zambian Copper: A case Study of Foreign Investment. Praeger Publishers, New York Hawkins, Jeffrey, 1991: "Understanding the failure of IMF reform: The Zambian case", in World Development, Vol. 19, No. 7 (pp. 839-849). Mupimpila, Christopher (1998). Global Product Chains: Northern Consumers, Southern Producers, And Sustainability: Copper from Zambia, Unpublished M. Sc. Thesis, Iowa State University, Ames, Iowa, USA. Republic of Zambia (1985). National Conservation Strategy. IUCN, Gland, Switzerland/Government of the Republic of Zambia, Government Printers, Lusaka, Zambia. World Bank (1993). Zambia - Prospects for Sustainable and Equitable Growth. Washington DC, World Bank. The Holy Bible. 1984. New International Version. Colorado Springs, USA: International Bible Society.
|